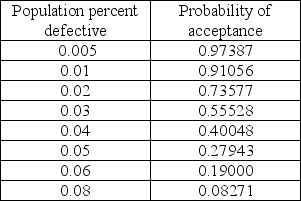
In the table below are selected values for the OC curve associated with the acceptance sampling plan n = 50,c = 1.(Watch out-the points are not evenly spaced. )Assume that upon failed inspection,defective items are replaced.Calculate the AOQ for each data point.(You may assume that the population is much larger than the sample. )Plot the AOQ curve.At approximately what population defective rate is the AOQ at its worst? Explain how this happens.How well does this plan meet the specifications of AQL = 0.0050,α = 0.05;LTPD = 0.05,β = 0.10? Discuss.
Correct Answer:
Verified
View Answer
Unlock this answer now
Get Access to more Verified Answers free of charge
Q84: A department chair wants to monitor the
Q125: The specifications for a manifold gasket that
Q146: The specification for a plastic handle calls
Q147: The specification for a plastic liner for
Q148: A car mechanic is thinking of guaranteeing
Q149: In the table below are selected values
Q152: The specifications for a manifold gasket that
Q154: A consultant has been brought in to
Q156: Larry's boat shop wants to monitor the
Q198: A city police chief decides to do
Unlock this Answer For Free Now!
View this answer and more for free by performing one of the following actions

Scan the QR code to install the App and get 2 free unlocks

Unlock quizzes for free by uploading documents