Figure Q10-7 shows data from one of the first experiments demonstrating LTP by Bliss and Lomo (1973). The arrows indicate points at which high frequency stimuli were given. 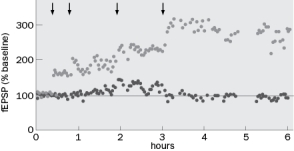 Figure
A. Figure Q10-7A below depicts an example of a field EPSP prior to high frequency stimulation. The vertical line is the stimulus artifact. What would the fEPSP look like at 1 hour and 4 hours? 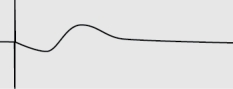 Figure Q10-7A
B. What would happen to the response if Bliss and Lomo had given a low frequency stimulation of about 1 Hz at 5 hours?
Question 10-8 and 10-9 refer to (Figure Q10-8) below. Figure Q10-8 shows a synaptic matrix, which describes how changes in synaptic weight can contribute to memory storage. There are presynaptic inputs A-E and postsynaptic outputs I-IV. 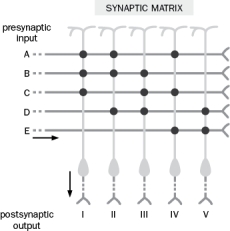 Figure
Correct Answer:
Verified
View Answer
Unlock this answer now
Get Access to more Verified Answers free of charge
Q1: Why was AP5 applied while the neuron
Q2: What is the basic circuitry of the
Q3: Which is true for spike-timing-dependent plasticity? Select
Q4: The amnesic patient, H.M., lost the ability
Q6: The amnesic patient, H.M., could still learn
Q7: What is synaptic plasticity?
Q8: Which is an example of associativity? Select
Q9: H.M. could still learn a motor task.
Q10: Why is CaMKII a good candidate for
Q68: What is long-term potentiation?
Unlock this Answer For Free Now!
View this answer and more for free by performing one of the following actions

Scan the QR code to install the App and get 2 free unlocks

Unlock quizzes for free by uploading documents