The following figure shows the demand curve ES, the average cost curve AC, the marginal cost curve MC, and the marginal revenue curve MR for a firm.
Figure 8-1
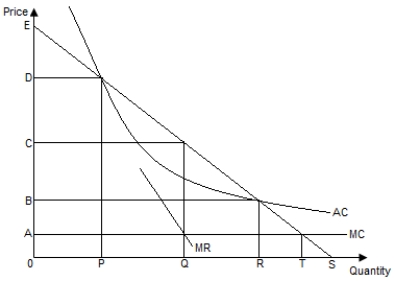
-Refer to Figure 8-1. Under average-cost pricing, the equilibrium price and output in the market are _____, respectively.
A) B and R
B) A and T
C) C and Q
D) D and P
E) A and Q
Correct Answer:
Verified
Q1: A monopolist produces and sells 400 units
Q2: The following figure shows the demand curve
Q4: Which of the following is a characteristic
Q5: Which of the following is true of
Q6: The following figure shows the demand curve
Q7: Which of the following is a criticism
Q8: Which of the following is true of
Q9: Industry demand is given by P =
Q10: A monopolist maximizes profit by producing:
A) on
Q11: A market is considered a pure monopoly
Unlock this Answer For Free Now!
View this answer and more for free by performing one of the following actions

Scan the QR code to install the App and get 2 free unlocks

Unlock quizzes for free by uploading documents