The following figure shows the domestic demand and supply curves for a good. With free trade, the price of the good in the domestic market is P3. The government introduces a 5% tariff in the market which raises the domestic price to P2.
Figure 7-1
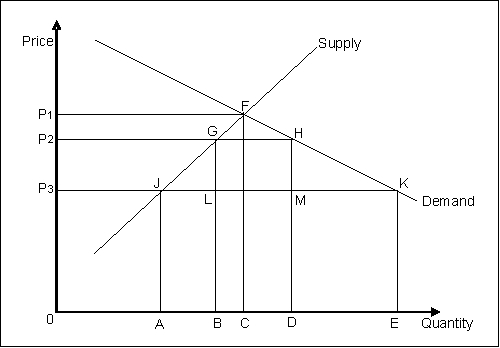
-Refer to Figure 7-1. When trade is not restricted, the level of imports to the domestic market is _____.
A) CD
B) AE
C) 0
D) BD
E) AC
Correct Answer:
Verified
Q29: The following figure shows the domestic demand
Q30: With free trade, the market for a
Q31: The following figure shows the domestic demand
Q32: When all trade is prohibited in good
Q33: Derive the long-run supply curve of a
Q35: The following figure shows the domestic demand
Q36: Suppose the equilibrium price of bread is
Q37: Derive the short-run supply curve of a
Q38: The following figure shows the domestic demand
Q39: For a perfectly competitive firm, long-run average
Unlock this Answer For Free Now!
View this answer and more for free by performing one of the following actions

Scan the QR code to install the App and get 2 free unlocks

Unlock quizzes for free by uploading documents