The following figure shows the long-run average cost curve of a firm.
Figure 6-1
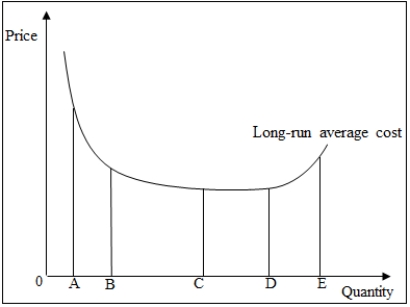
-Refer to Figure 6-1. The production function of the firm displays constant returns to scale when output is increased from _____.
A) A to E
B) C to D
C) D to E
D) A to B
E) B to D
Correct Answer:
Verified
Q1: Assume that an investor invests $100,000 in
Q3: If short-run average cost is increasing then:
A)
Q4: When average total cost is at its
Q5: Amanda invests $500,000 in a new business
Q6: Which of the following is true of
Q7: A firm that produces and sells
Q8: The average fixed cost for a firm
A)
Q9: Which of the following is true of
Q10: A law firm will be paid $500
Q11: Bill gives up his present job in
Unlock this Answer For Free Now!
View this answer and more for free by performing one of the following actions

Scan the QR code to install the App and get 2 free unlocks

Unlock quizzes for free by uploading documents