The following figure shows the long-run average cost curve of a firm.
Figure 6-1
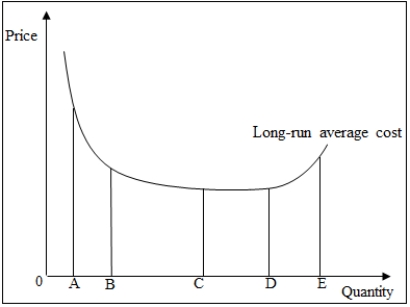
-Refer to Figure 6-1. The production function of the firm displays decreasing returns to scale at all levels of output between _____.
A) A to E
B) C to D
C) D to E
D) A to B
E) B to D
Correct Answer:
Verified
Q17: The money that a firm has already
Q18: Dana, who is a trained yoga instructor,
Q19: A firm produces 100 units of output
Q20: If a firm were to stop production
Q21: A firm's long-run average cost curve is
Q23: The following figure shows the long-run average
Q24: The average variable cost of producing 1,
Q25: Assume that the minimum efficient scale for
Q26: A profit-maximizing firm should shut down in
Q27: Briefly describe the economic cost of a
Unlock this Answer For Free Now!
View this answer and more for free by performing one of the following actions

Scan the QR code to install the App and get 2 free unlocks

Unlock quizzes for free by uploading documents