Use Figure 1 to answer questions
Figure SEQ Figure 1: Elasticities of Demand 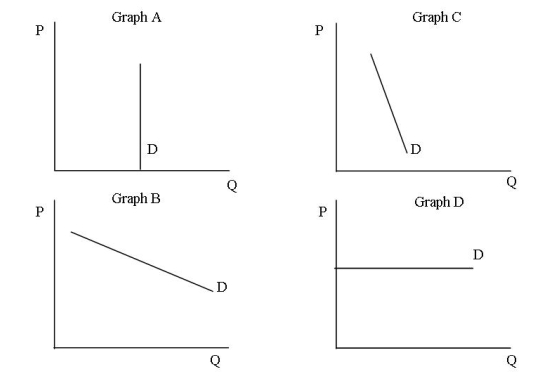
-Which of the graphs illustrate a perfectly elastic demand curve?
A) Graph A
B) Graph B
C) Graph C
D) Graph D
Correct Answer:
Verified
Q1: When a given percent change in the
Q2: Price elasticity of demand measures
A)The responsiveness of
Q3: Use the following information to answer
Q4: Use Figure 1 to answer questions
Figure
Q5: Which of the following measures the price
Q7: Use the following information to answer
Q8: The ratio of the percentage change in
Q9: The amount of money earned when a
Q10: Use Figure 1 to answer questions
Figure
Q11: If the elasticity of demand is less
Unlock this Answer For Free Now!
View this answer and more for free by performing one of the following actions

Scan the QR code to install the App and get 2 free unlocks

Unlock quizzes for free by uploading documents