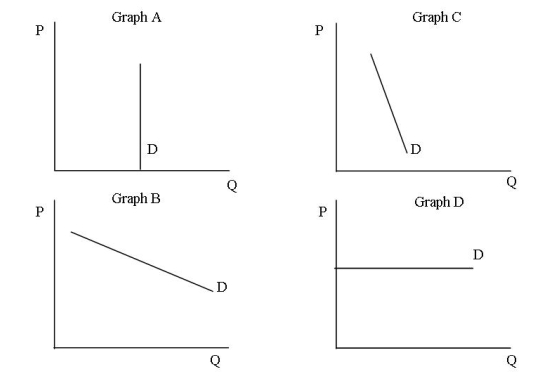
Use Figure 1 to answer questions
Figure SEQ Figure 1: Elasticities of Demand 
-Which of the graphs illustrate a relatively inelastic demand curve?
A) Graph A
B) Graph B
C) Graph C
D) Graph D
Correct Answer:
Verified
Q5: Which of the following measures the price
Q6: Use Figure 1 to answer questions
Figure
Q7: Use the following information to answer
Q8: The ratio of the percentage change in
Q9: The amount of money earned when a
Q11: If the elasticity of demand is less
Q12: All of the following are determinants of
Q13: Use Figure 1 to answer questions
Figure
Q14: Use the following information to answer
Q15: Use Figure 1 to answer questions
Figure
Unlock this Answer For Free Now!
View this answer and more for free by performing one of the following actions

Scan the QR code to install the App and get 2 free unlocks

Unlock quizzes for free by uploading documents