Use Figure 1 to answer questions
Figure SEQ Figure 1: Elasticities of Demand 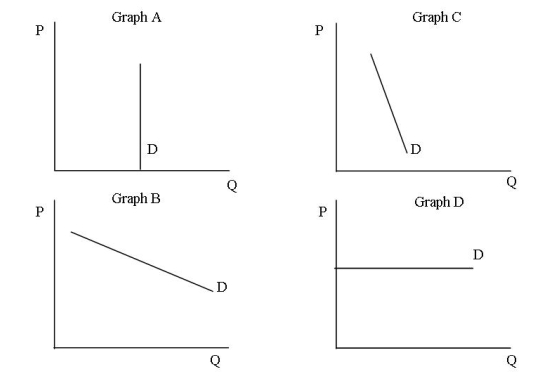
-Which of the graphs illustrate a good whose percentage change in quantity demanded is greater than the percentage change in price?
A) Graph A
B) Graph B
C) Graph C
D) Graph D
Correct Answer:
Verified
Q10: Use Figure 1 to answer questions
Figure
Q11: If the elasticity of demand is less
Q12: All of the following are determinants of
Q13: Use Figure 1 to answer questions
Figure
Q14: Use the following information to answer
Q16: When a given percent change in the
Q17: The measurement of responsiveness between two variables
Q18: If the elasticity of demand is greater
Q19: The price of a good increases by
Q20: Use Figure 1 to answer questions
Figure
Unlock this Answer For Free Now!
View this answer and more for free by performing one of the following actions

Scan the QR code to install the App and get 2 free unlocks

Unlock quizzes for free by uploading documents