Refer to the figure given below. 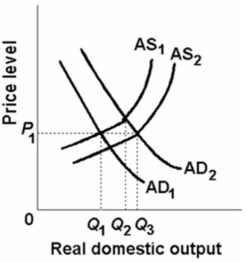 In the above figure, AD1 and AS1 represent the original aggregate demand and aggregate supply curves, respectively.AD2 and AS2 show the new aggregate demand and aggregate supply curves.The change in aggregate supply from AS1 to AS2 could be caused by:
A) a reduction in the price level.
B) an increased availability of entrepreneurial talent.
C) an increase in business taxes.
D) the real-balances effect, interest-rate effect, and foreign-trade effect.
Correct Answer:
Verified
Q145: The aggregate expenditures model and the aggregate
Q168: Refer to the diagram given below.There are
Q170: The relationship between the aggregate demand curve
Q171: Refer to the diagram given below.

Unlock this Answer For Free Now!
View this answer and more for free by performing one of the following actions

Scan the QR code to install the App and get 2 free unlocks

Unlock quizzes for free by uploading documents