Refer to the figure below. 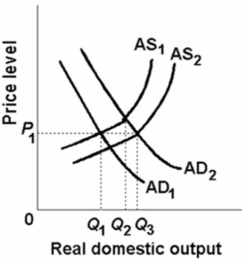 In the above figure, AD1 and AS1 represent the original aggregate demand and aggregate supply curves, respectively.AD2 and AS2 show the new aggregate demand and supply curves.The changes in aggregate demand and aggregate supply result in a(n) :
A) increase in the price level.
B) increase in the real output and no change in the price level.
C) increase in the real output and the price level.
D) decline in the real output and no change in the price level.
Correct Answer:
Verified
Q145: The aggregate expenditures model and the aggregate
Q170: The relationship between the aggregate demand curve
Q171: Refer to the diagram given below.
Unlock this Answer For Free Now!
View this answer and more for free by performing one of the following actions

Scan the QR code to install the App and get 2 free unlocks

Unlock quizzes for free by uploading documents