A shirt production company has tracked their sales of red and blue shirts over the past few years.The graph of both is shown below. 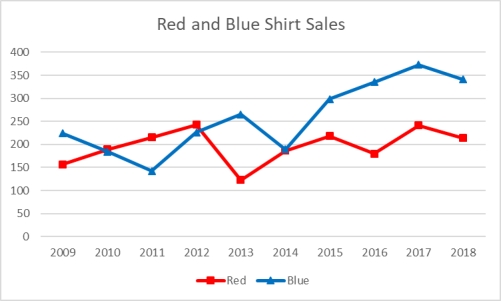 In what years were red shirt sales higher than blue shirt sales?
A) 2009 through 2012
B) 2010, 2011, and 2015
C) 2011, 2012, and 2013
D) 2013, 2015, 2016, 2017, and 2018
E) 2010, 2011, and 2012
Correct Answer:
Verified
Q102: The following time-series data shows the
Q103: The following time-series data shows the
Q104: To show hourly sales throughout a day,
Q105: A shirt production company has tracked their
Q106: Monthly sales were tracked and shown on
Q108: A shirt production company has tracked their
Q109: Sales are tracked during the past year
Q110: Monthly sales were tracked and shown on
Q111: A shirt production company has tracked their
Q112: Sales are tracked during the past year
Unlock this Answer For Free Now!
View this answer and more for free by performing one of the following actions

Scan the QR code to install the App and get 2 free unlocks

Unlock quizzes for free by uploading documents