A shirt production company has tracked their sales of red and blue shirts over the past few years.The graph of both is shown below. 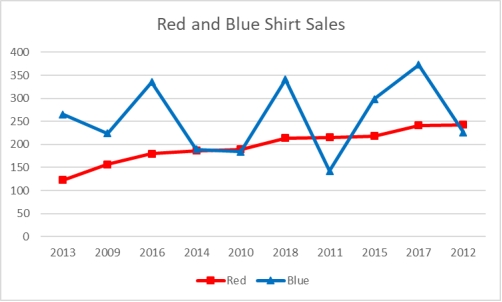 What trends can be identified from this graph?
A) Sales of red shirts have consistently increased throughout this time.
B) Sales of blue shirts are currently declining.
C) Between 2010 and 2018, sales of blue shirts consistently increased.
D) Cannot determine trends as data not in chronological order.
E) The smallest annual increase in red shirt sales was between the years of 2010 and 2014.
Correct Answer:
Verified
Q103: The following time-series data shows the
Q104: To show hourly sales throughout a day,
Q105: A shirt production company has tracked their
Q106: Monthly sales were tracked and shown on
Q107: A shirt production company has tracked their
Q108: A shirt production company has tracked their
Q109: Sales are tracked during the past year
Q110: Monthly sales were tracked and shown on
Q112: Sales are tracked during the past year
Q113: A shirt production company has tracked their
Unlock this Answer For Free Now!
View this answer and more for free by performing one of the following actions

Scan the QR code to install the App and get 2 free unlocks

Unlock quizzes for free by uploading documents