(Figure: Bread and Honey) In the graph, point b represents: 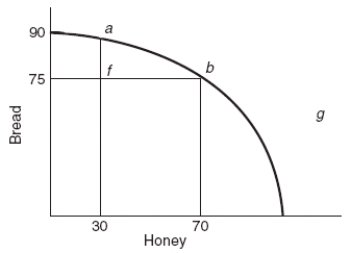
A) a point of inefficiency.
B) a point where all of society's resources are fully employed.
C) a better economic situation than point a.
D) economic growth.
Correct Answer:
Verified
Q77: Which statement BEST illustrates increasing opportunity costs?
A)
Q127: (Figure: Bread and Honey) In the graph,
Q129: Which shaped curve reflects the reality that
Q130: (Table: Production Possibilities Schedule) If the
Q133: (Table: Production Possibilities Schedule) In the
Q134: (Table: Production Possibilities Schedule) In the
Q135: Suppose that in Japan one worker can
Q136: (Table) Given the production possibilities schedule
Q147: Increasing opportunity costs occur along the production
Q338: If a producer does NOT face increasing
Unlock this Answer For Free Now!
View this answer and more for free by performing one of the following actions

Scan the QR code to install the App and get 2 free unlocks

Unlock quizzes for free by uploading documents