(Figure: Bread and Honey) In the graph, a move from point f to point g: 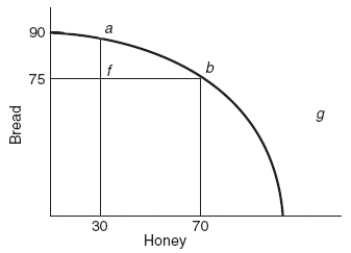
A) is a move from full employment to less than full employment.
B) is impossible with the resources that are available.
C) is a move from an inefficient point to one that fully utilizes all the available resources.
D) reflects a positive opportunity cost tradeoff.
Correct Answer:
Verified
Q77: Which statement BEST illustrates increasing opportunity costs?
A)
Q105: If an economy faces increasing opportunity costs
Q122: (Figure: Bread and Honey) Which point in
Q123: (Figure: Bread and Honey) As more honey
Q125: (Figure: Bread and Honey) In the graph,
Q126: (Table) According to the table, the
Q129: Which shaped curve reflects the reality that
Q130: (Table: Production Possibilities Schedule) If the
Q132: (Figure: Bread and Honey) In the graph,
Q338: If a producer does NOT face increasing
Unlock this Answer For Free Now!
View this answer and more for free by performing one of the following actions

Scan the QR code to install the App and get 2 free unlocks

Unlock quizzes for free by uploading documents