Multiple Choice
Looking at the distribution of data on the bar chart below, how best can it be described? 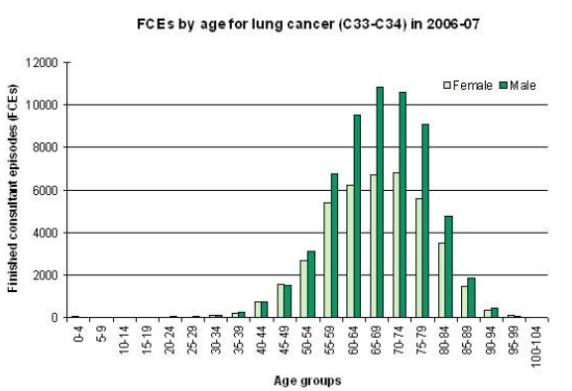
Source: http:/ / www.hesonline.nhs.uk/ Ease/ servlet/ ContentServer?siteID=1937&categoryID=955
A) Normally distributed
B) Negatively skewed
C) Positively skewed
D) Leptokurtic
Correct Answer:
Verified
Related Questions
Unlock this Answer For Free Now!
View this answer and more for free by performing one of the following actions

Scan the QR code to install the App and get 2 free unlocks

Unlock quizzes for free by uploading documents