The following graph shows 2 isocost curves for a firm. The price of capital is $200. 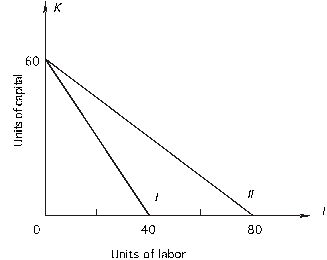
a. The total cost associated with isocost I is $_________, and the price of labor is $_________.
b. The equation for isocost I is _____________________. With isocost I the firm must give up ______ units of capital to purchase one more unit of labor in the market.
c. The total cost associated with isocost II is $_________, and the price of labor is $_________.
d. The equation for isocost II is _____________________. With isocost II the firm must give up ______ units of capital to purchase one more unit of labor in the market.
Correct Answer:
Verified
b....
View Answer
Unlock this answer now
Get Access to more Verified Answers free of charge
Q82: Economies of scale exist when
A)fixed cost decreases
Q87: Learning economies differ from economies of scale
Q87: A firm is using 20 units of
Q88: You read a story in the newspaper
Q89: The following graph shows one of a
Q90: Afirm is producing 1,000 units of output
Q94: To answer the questions, use the
Q95: In the following figure, isoquant I is
Q96: If there are no fixed costs in
Q97: Answer the following questions concerning an expansion
Unlock this Answer For Free Now!
View this answer and more for free by performing one of the following actions

Scan the QR code to install the App and get 2 free unlocks

Unlock quizzes for free by uploading documents