The following graph shows one of a firm's isocost curves and isoquants. 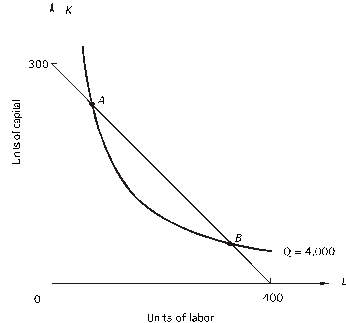
a. Combination A is not an economically efficient method of producing 4,000 units of output because, at A, _________ exceeds _________ or, in other words, _________ exceeds _________. The firm should increase ___________ and decrease ___________.
b. Combination B is not an economically efficient method of producing 4,000 units of output because, at B, _________ exceeds _________, or, in other words, _________ exceeds _________. The firm should increase ___________ and decrease ___________.
c. At the economically efficient method of producing 4,000 units of output the MRTS will equal _________.
Correct Answer:
Verified
View Answer
Unlock this answer now
Get Access to more Verified Answers free of charge
Q82: Economies of scale exist when
A)fixed cost decreases
Q84: Refer to the following: Q86: Refer to the following: Q86: Economies of scale exist when Q87: A firm is using 20 units of Q87: Learning economies differ from economies of scale Q88: You read a story in the newspaper Q90: Afirm is producing 1,000 units of output Q93: The following graph shows 2 isocost Q94: To answer the questions, use the
![]()
![]()
A)total cost decreases
Unlock this Answer For Free Now!
View this answer and more for free by performing one of the following actions

Scan the QR code to install the App and get 2 free unlocks

Unlock quizzes for free by uploading documents