This bar chart displays the demographics of a Business Analysis class. How many male students are in the class? 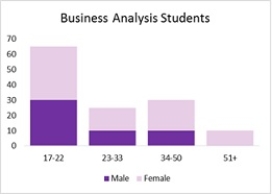
A) 30
B) 50
C) 80
D) 130
Correct Answer:
Verified
Q35: Consider the clustered bar chart of the
Q36: A _ is used for examining data
Q37: The best way to differentiate chart elements
Q38: A two-dimensional graph representing the data using
Q39: An alternative for a stacked column chart
Q41: Which of the following graphs cannot be
Q42: Natalie needs to compare the number of
Q43: Susan would like to create a graph
Q44: Never use a _ chart when a
Q45: Construct a scatter chart for the
Unlock this Answer For Free Now!
View this answer and more for free by performing one of the following actions

Scan the QR code to install the App and get 2 free unlocks

Unlock quizzes for free by uploading documents