The table gives the median household income (in 2005 year) for two cities in various years. Let x represent the median household income for citizens of city A and y represent the corresponding median household income for citizens of city B. Find a linear model that expresses the median household income for citizens in city B as a function of the median household income for citizens of city B. Interpret the slope of the linear model. Round numerical values in your answer to three decimal places. 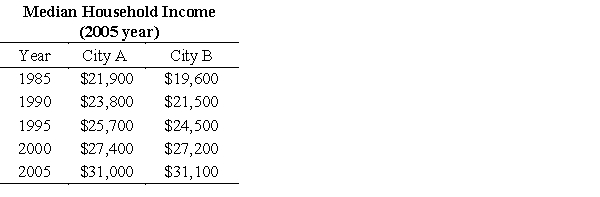
A) 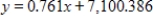
Slope: median household income is growing at the same rate for city A as it is for city B.
B) 
Slope: median household income is growing at the same rate for city A as it is for city B.
C) 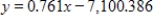
Slope: median household income is growing at the same rate for city A as it is for city B.
D) 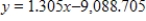
Slope: median household income is growing faster for city A than it is for city B.
E) 
Slope: median household income is growing slower for city A than it is for city B.
Correct Answer:
Verified
Q103: Graph the power function that models the
Q104: The table shows the average earnings of
Q105: Suppose the following table gives the U.S.
Q106: The table gives the percent of the
Q107: The table below shows the national expenditures
Q108: Determine what type of function best models
Q109: The table that follows gives the population
Q110: Suppose the IQ scores (rounded to the
Q111: Determine whether the scatter plot should be
Q112: Determine what type of function best models
Unlock this Answer For Free Now!
View this answer and more for free by performing one of the following actions

Scan the QR code to install the App and get 2 free unlocks

Unlock quizzes for free by uploading documents