A soft drink company is interested in seeing how the demand for its products is affected by price.The company believes that the quantity, q, of soft drinks sold depends on , the average price of the company's soft drinks, and , the average price of competing soft drinks.Which of the graphs below is most likely to represent q as a function of and ?
A) 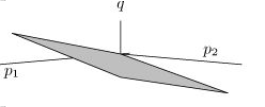
B) 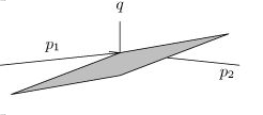
C) 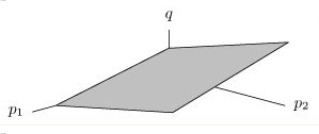
D) 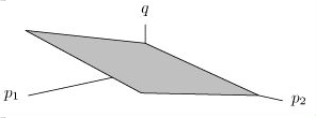
Correct Answer:
Verified
Q35: Let Q36: The contour diagram below shows the level Q37: Two contours of the function f(x, y)corresponding Q38: Find a formula for a function Q39: For what values of the constant Q41: A plane passes through the points (1, Q42: A linear function f(x,y)has cross-sections f(x,4)= 2x Q43: Sketch the level set of Q44: Consider the plane that passes through the Q45: A linear function f(x, y)has the values
Unlock this Answer For Free Now!
View this answer and more for free by performing one of the following actions

Scan the QR code to install the App and get 2 free unlocks

Unlock quizzes for free by uploading documents