Essay
The contour diagram below shows the level curves of the difference between July and January mean temperatures in ° F. 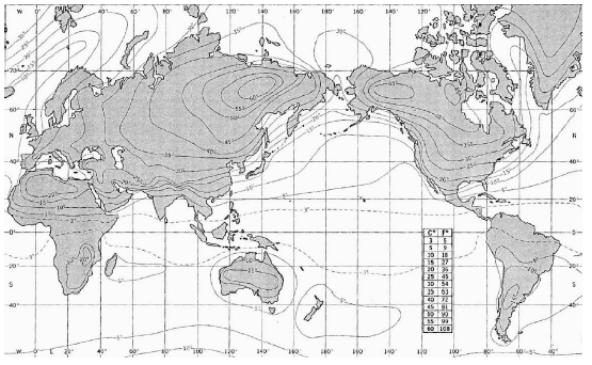 Does this graph support or contradict the claim that the largest annual temperature variations are found on the coasts of continents?
Correct Answer:
Verified
This graph supports the claim ...
View Answer
Unlock this answer now
Get Access to more Verified Answers free of charge
Related Questions
Q31: Draw a possible contour diagram for the
Q32: Suppose that the temperature T of
Q33: Match the following function with the graphs
Q34: The picture below is the contour diagram
Unlock this Answer For Free Now!
View this answer and more for free by performing one of the following actions

Scan the QR code to install the App and get 2 free unlocks

Unlock quizzes for free by uploading documents