Essay
The picture below is the contour diagram of f(x, y).The areas between contours have been shaded.Lighter shades represent higher levels, while darker shades represent lower levels. 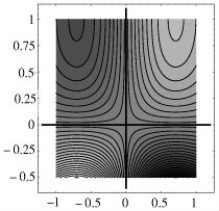 Sketch the cross section of f(x, y)with x fixed at x = 0.5.
Correct Answer:
Verified
Related Questions
Q29: Draw the level curves for z =
Q30: What is the slope of the
Q31: Draw a possible contour diagram for the
Q32: Suppose that the temperature T of
Q33: Match the following function with the graphs
Unlock this Answer For Free Now!
View this answer and more for free by performing one of the following actions

Scan the QR code to install the App and get 2 free unlocks

Unlock quizzes for free by uploading documents