Use the figure to answer the question.
-The wages of the employees of a company are presented in this histogram. Assume that $6 is in the interval $6-$8, not $4-$6, similarly for $8, $10, and $12. 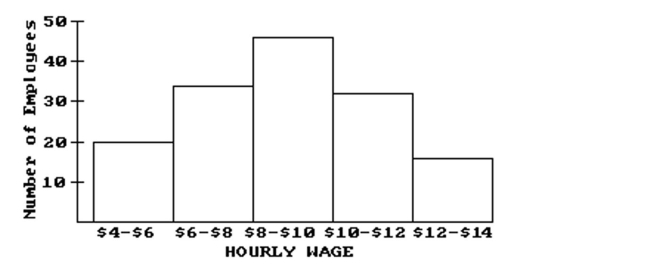 How many employees earn at least $4 and less than $6 an hour?
A) 20
B) 10
C) 34
D) 22
Correct Answer:
Verified
Q34: Use the figure to answer the question.
-This
Q35: Construct the requested statistical display.
-The numbers
Q36: Use the figure to answer the question.
-This
Q37: Use the circle graph to solve the
Q38: Use the figure to answer the question.
-The
Q40: Use the figure to answer the question.
-Students
Q41: Use the figure to answer the
Q42: Identify whether the given scatterplot shows a
Q43: Use the figure to answer the question.
-The
Q44: Use the figure to answer the question.
-The
Unlock this Answer For Free Now!
View this answer and more for free by performing one of the following actions

Scan the QR code to install the App and get 2 free unlocks

Unlock quizzes for free by uploading documents