Use the circle graph to solve the problem.
-In a school survey, students showed these preferences for instructional materials. 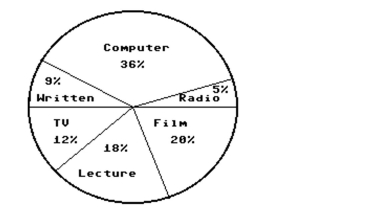 About how many students would you expect to prefer lectures in a school of 750 students?
A) About 135 students
B) About 150 students
C) About 270 students
D) About 18 students
Correct Answer:
Verified
Q32: Use the figure to answer the question.
-The
Q33: Use the circle graph to solve the
Q34: Use the figure to answer the question.
-This
Q35: Construct the requested statistical display.
-The numbers
Q36: Use the figure to answer the question.
-This
Q38: Use the figure to answer the question.
-The
Q39: Use the figure to answer the question.
-The
Q40: Use the figure to answer the question.
-Students
Q41: Use the figure to answer the
Q42: Identify whether the given scatterplot shows a
Unlock this Answer For Free Now!
View this answer and more for free by performing one of the following actions

Scan the QR code to install the App and get 2 free unlocks

Unlock quizzes for free by uploading documents