Solve the problem.
-The table below shows the sales and profits of a company from 2000 to 2005. Construct a scatter diagram for the data and state whether sales and profits for this company have no correlation, a positive correlation, or a negative correlation for this period.
A) Negative correlation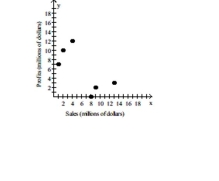
B) Positive correlation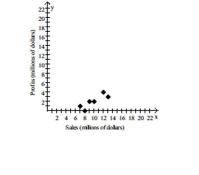
C) No correlation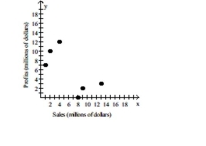
D) No correlation
Correct Answer:
Verified
Q15: State whether there is no correlation, a
Q16: State whether you believe the two variables
Q17: State whether you believe the two variables
Q18: Solve the problem.
-The following table gives
Q19: How does the outlier affect the correlation
Q21: Solve the problem. Round your answers
Q22: Write the coordinates of a point that
Q23: To get the best deal on
Q24: The table contains the weights (in
Q25: Construct a scatter diagram with several groups
Unlock this Answer For Free Now!
View this answer and more for free by performing one of the following actions

Scan the QR code to install the App and get 2 free unlocks

Unlock quizzes for free by uploading documents