Solve the problem. Round your answers to the nearest whole percent.
-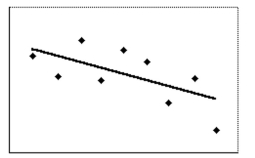
The scatter diagram shows the data for the number of cars waiting by a school (y) and the amount of time after tl of classes (x) . The correlation coefficient is . Determine how much of the variation in the number of wait cars can be accounted for by the best-fit line.
A)
B)
C)
D) end
Correct Answer:
Verified
Q16: State whether you believe the two variables
Q17: State whether you believe the two variables
Q18: Solve the problem.
-The following table gives
Q19: How does the outlier affect the correlation
Q20: Solve the problem.
-The table below shows
Q22: Write the coordinates of a point that
Q23: To get the best deal on
Q24: The table contains the weights (in
Q25: Construct a scatter diagram with several groups
Q26: Construct a scatter diagram with two groups
Unlock this Answer For Free Now!
View this answer and more for free by performing one of the following actions

Scan the QR code to install the App and get 2 free unlocks

Unlock quizzes for free by uploading documents