Multiple Choice
Which line chart below represents the data?
A) 
B) 
C) 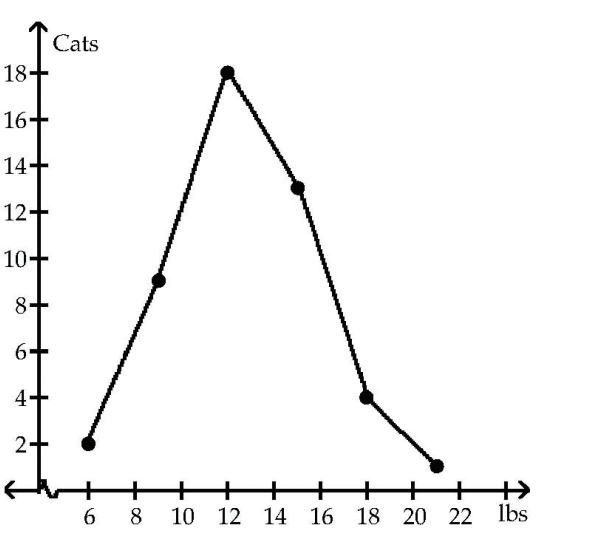
D) None of the above
Correct Answer:
Verified
Related Questions
Q9: Find the original data from the
Q10: On Monday mornings, a bookie tabulates the
Q11: Wagenlucht Ice Cream Company is always trying
Q12: The data below are the numbers of
Unlock this Answer For Free Now!
View this answer and more for free by performing one of the following actions

Scan the QR code to install the App and get 2 free unlocks

Unlock quizzes for free by uploading documents