The data below are the numbers of hours of homework done as reported by 24 high school juniors for the last week in September, 2006.
6, 5, 6, 4, 6, 6, 9, 7, 6, 3, 8, 5, 5, 8, 6, 5, 8, 6, 5, 7, 5, 8, 7, 4
Using bins of 2 hours width, which relative frequency histogram represents the data?
A) 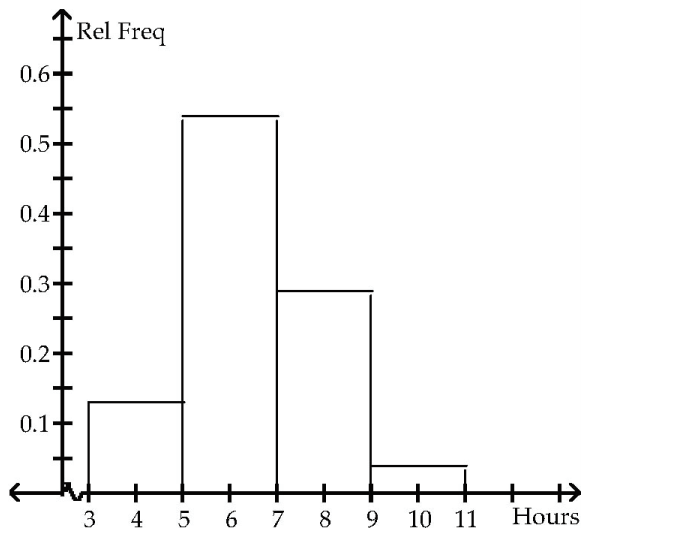
B) 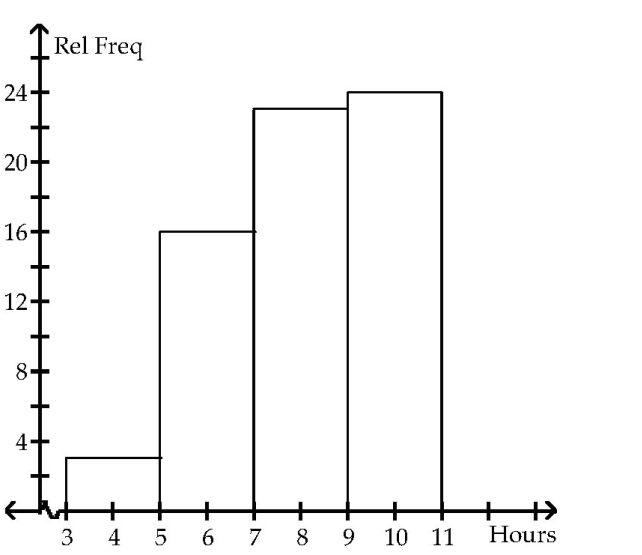
C) 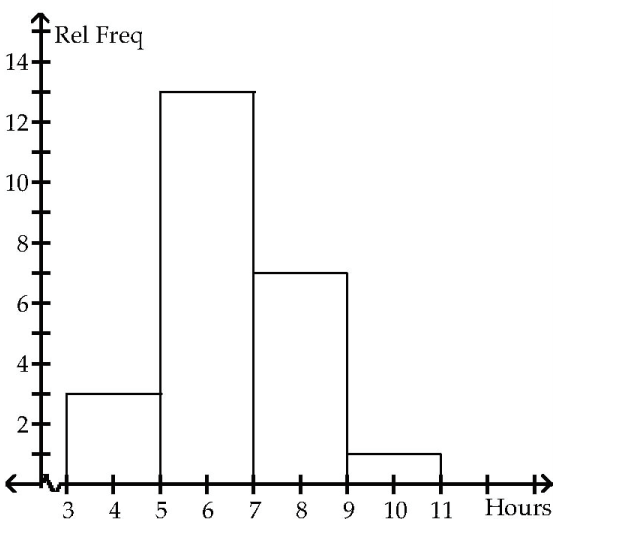
D) None of the above
Correct Answer:
Verified
Q7: The table lists the winners of
Q8: A nurse measured the blood pressure of
Q9: Find the original data from the
Q10: On Monday mornings, a bookie tabulates the
Q11: Wagenlucht Ice Cream Company is always trying
Unlock this Answer For Free Now!
View this answer and more for free by performing one of the following actions

Scan the QR code to install the App and get 2 free unlocks

Unlock quizzes for free by uploading documents