The data below represent the results of a poll in which the following question was asked:, "To what degree are you satisfied with the outcome of the 2012 gubernatorial election?" Which pie chart below represents the given data set?
A)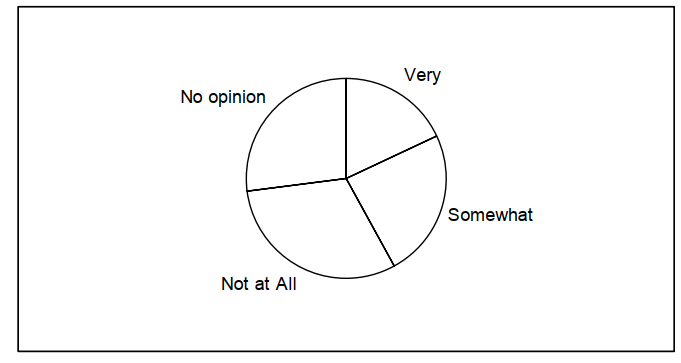
B)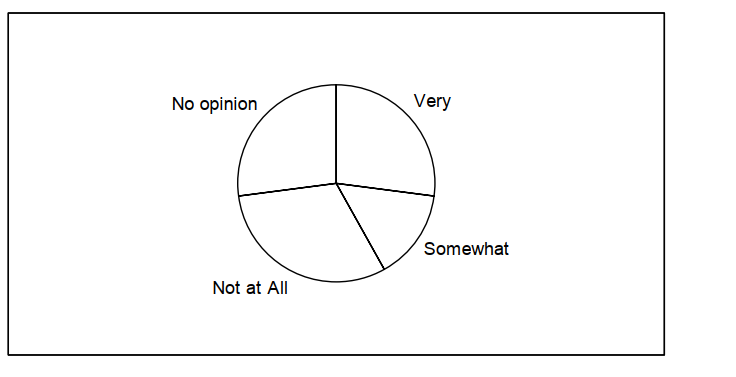
Correct Answer:
Verified
Q1: The table shows the price of
Q3: using the graphical display below.
Q4: The following dot plot represents the ages
Q5: The frequency table shows the lengths
Q6: After reviewing a movie, 400 people
Q7: The table lists the winners of
Q8: A nurse measured the blood pressure of
Q9: Find the original data from the
Q10: On Monday mornings, a bookie tabulates the
Q11: Wagenlucht Ice Cream Company is always trying
Unlock this Answer For Free Now!
View this answer and more for free by performing one of the following actions

Scan the QR code to install the App and get 2 free unlocks

Unlock quizzes for free by uploading documents