The table shows the price of a volatile stock from the months January 1999 through December 1999 as determined by the closing price on the last trading day of the month. The price is rounded to the nearest dollar.
Which time series line chart represents the data?
A) 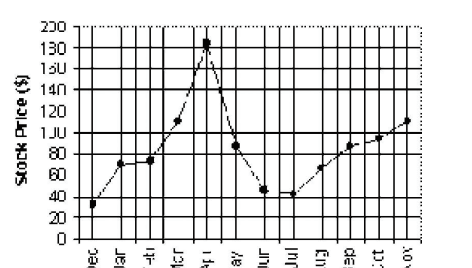
B) 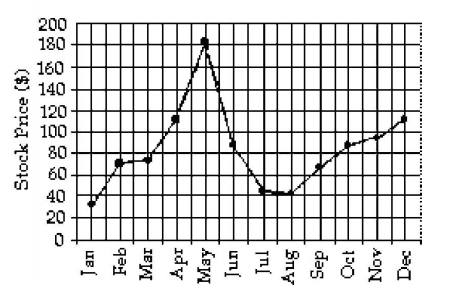
C) 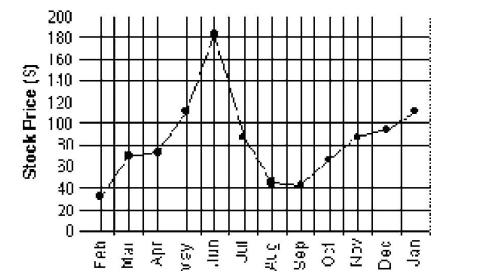
D) None of the above
Correct Answer:
Verified
Q2: The data below represent the results
Q3: using the graphical display below.
Q4: The following dot plot represents the ages
Q5: The frequency table shows the lengths
Q6: After reviewing a movie, 400 people
Q7: The table lists the winners of
Q8: A nurse measured the blood pressure of
Q9: Find the original data from the
Q10: On Monday mornings, a bookie tabulates the
Q11: Wagenlucht Ice Cream Company is always trying
Unlock this Answer For Free Now!
View this answer and more for free by performing one of the following actions

Scan the QR code to install the App and get 2 free unlocks

Unlock quizzes for free by uploading documents