300 casino patrons, were interviewed as they left the casino. 90 of them said they spent most of the time playing the slots. 90 of them said they played blackjack. 45 said they played craps. 15 said roulette. 15 said poker. The rest were not sure what they played the most. Construct a Pareto chart to depict the gaming practices of the group of casino goers. Choose the vertical scale so that the relative frequencies are represented. 
A) 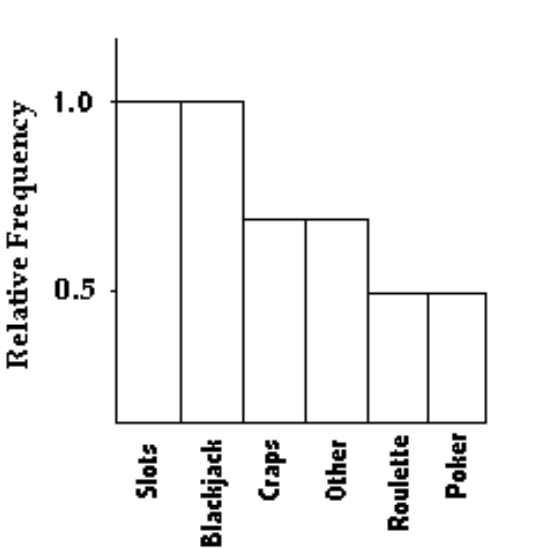
B) 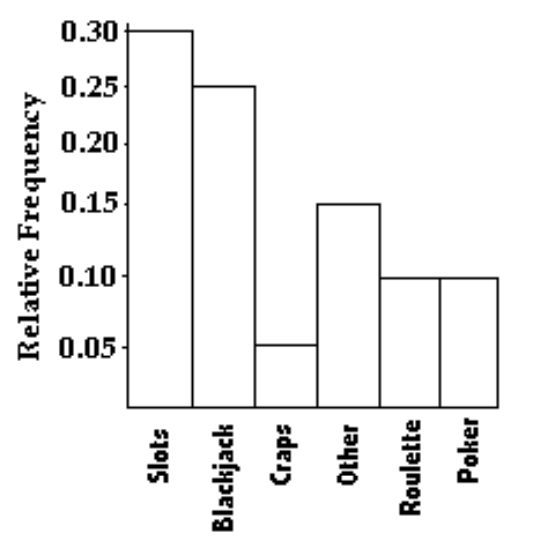
C) 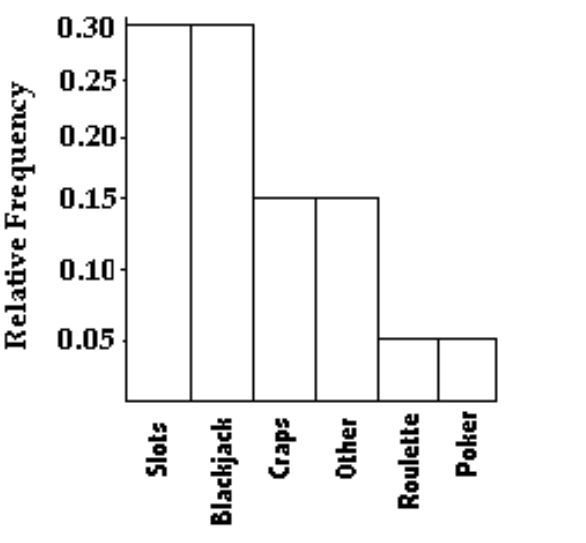
D) 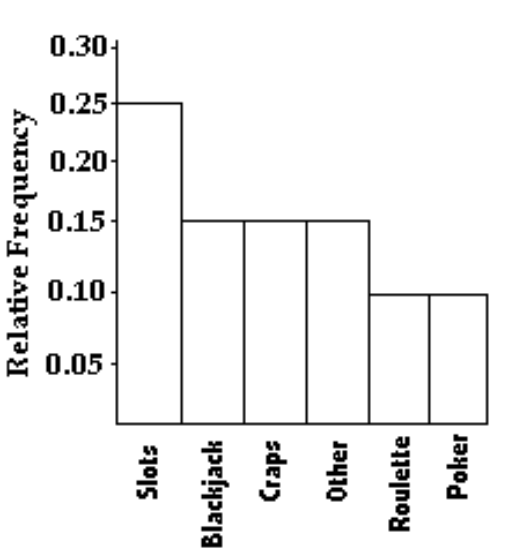
Correct Answer:
Verified
Q75: Construct a pie chart representing the
Q76: Use the given paired data to
Q77: Construct a pie chart representing the
Q78: Construct the cumulative frequency distribution that
Q79: The following frequency distribution analyzes the
Q80: The histogram below represents the number of
Q81: The frequency distribution below summarizes the
Q82: Use the data to create a
Q83: A store manager counts the number
Q84: The frequency chart shows the distribution
Unlock this Answer For Free Now!
View this answer and more for free by performing one of the following actions

Scan the QR code to install the App and get 2 free unlocks

Unlock quizzes for free by uploading documents