Engineers want to know what factors are associated with gas mileage. The regression
below predicts the average miles per gallon (MPG) for 82 cars using their engine
horsepower (HP) and weight (WT, in 100's of pounds). Dependent variable is MPG
squared R squared (adjusted) with degrees of freedom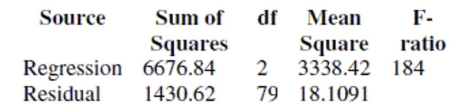
a. Write down the regression equation.
b. Write down the hypotheses for the test of the coefficient of horsepower. Conduct the test
and explain your conclusion in the context of this problem.
c. Write down the hypotheses for the test of the coefficient of weight. Conduct the test and
explain your conclusion in the context of this problem.
d. Explain the meaning of the coefficient of weight in the context of this problem.
e. Explain the meaning of the intercept of this regression in the context of this problem.
f. Compute the predicted gas mileage of a 3500 pound car with a 150 horsepower engine.
The plots are MPG vs. HP, MPG vs. WT, residuals vs. predicted values, and a normal
probability plot of residuals. 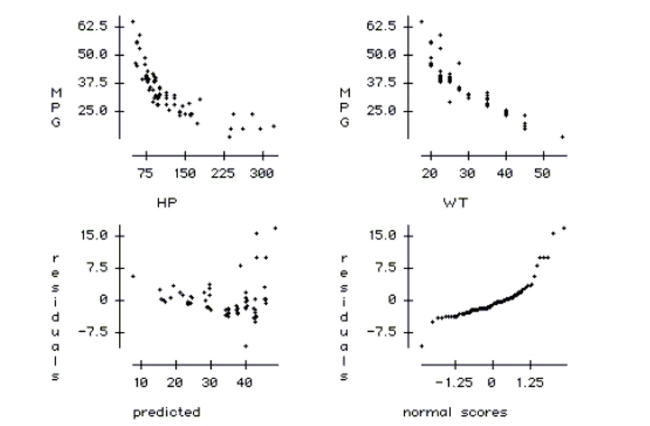
g. Check the conditions of this regression and comment on whether they are satisfied.
Correct Answer:
Verified
View Answer
Unlock this answer now
Get Access to more Verified Answers free of charge
Q1: In ANOVA, an interaction between two factors
Q2: Homelessness is a problem in many
Q3: In regression an observation has high leverage
Q4: Check the conditions for the regression and
Q6: Here are data about the average
Q7: In ANOVA, the Bonferroni method is used
Q8: To discourage cheating, a professor makes
Q10: Which of the following are NOT
Q11: The problem of collinearity occurs when
A) at
Q32: Of the 23 first year male
Unlock this Answer For Free Now!
View this answer and more for free by performing one of the following actions

Scan the QR code to install the App and get 2 free unlocks

Unlock quizzes for free by uploading documents