The scatterplot below shows the hat size and IQ of some adults. Is the trend positive, negative, or near zero? 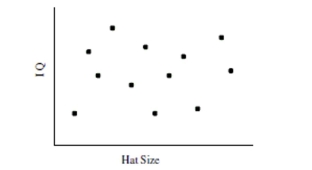
A) Positive
B) Near Zero
C) Negative
Correct Answer:
Verified
Q21: Which of the following statements regarding the
Q25: The data in the table represent
Q27: Suppose it has been established that
Q28: The following model was created to show
Q32: Choose the best statement to summarize the
Q33: Use the following information to answer the
Q33: The scatterplot below shows the hat size
Q34: The scatterplot below shows the number of
Q39: Use the following information to answer the
Q45: State the explanatory variable and the response
Unlock this Answer For Free Now!
View this answer and more for free by performing one of the following actions

Scan the QR code to install the App and get 2 free unlocks

Unlock quizzes for free by uploading documents