The table shows the number of minutes ridden on a stationary bike and the approximate number of calories burned. Plot the points on the grid provided then choose the most likely correlation coefficient from the answer choices below. 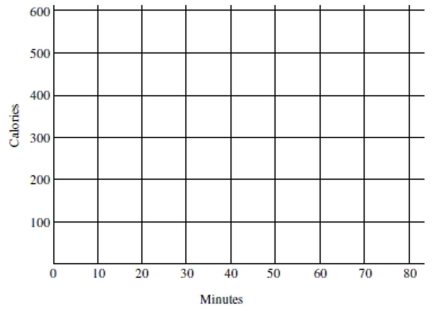
A) -0.30
B) 0.99
C) 0.30
D) -0.99
Correct Answer:
Verified
Q7: What key things should you look for
Q16: A veterinarian is going to investigate whether
Q18: Choose the scatterplot that matches the
Q19: A horticulturist conducted an experiment on 110
Q20: The scatterplot below shows the number of
Q23: Choose the scatterplot that matches the
Q24: A horticulturist conducted an experiment on
Q25: Use the following information to answer the
Q25: The data in the table represent
Q45: State the explanatory variable and the response
Unlock this Answer For Free Now!
View this answer and more for free by performing one of the following actions

Scan the QR code to install the App and get 2 free unlocks

Unlock quizzes for free by uploading documents