Multiple Choice
FIGURE 2-3 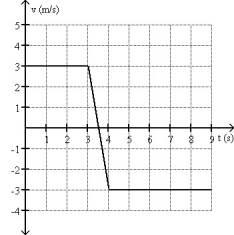
-Fig. 2-3 shows the velocity of an object as a function of time. Which graph best represents the acceleration as a function of time?
A) 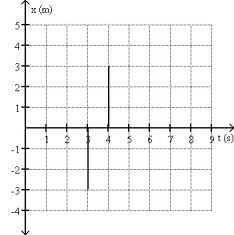
B) 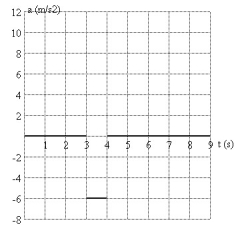
C) 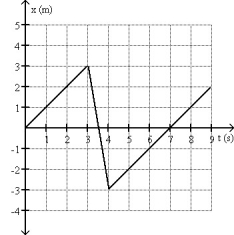
D) 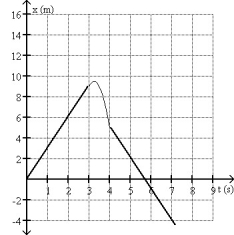
E) none of the above
Correct Answer:
Verified
Related Questions
Q7: Car A is traveling at twice the
Q13: It is possible to have a zero
Q14: When the velocity and acceleration of an
Q18: Suppose that a car traveling to the
Q21: If the velocity of an object is
Q21: During the time that the acceleration of
Unlock this Answer For Free Now!
View this answer and more for free by performing one of the following actions

Scan the QR code to install the App and get 2 free unlocks

Unlock quizzes for free by uploading documents