FIGURE 2-4 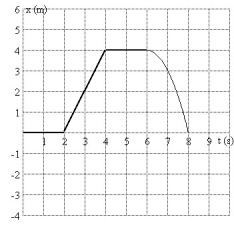
-A graph of position as a function of time is shown in Fig. 2-4. During which time interval could the object be possibly moving with non-zero constant acceleration?
A) 0.1 s to 1.9 s
B) 4.1 s to 5.9 s
C) 2.1 s to 3.9 s
D) 6.1 s to 7.9 s
E) There is no interval that is consistent with constant non-zero acceleration.
Correct Answer:
Verified
Q7: Car A is traveling at twice the
Q14: When the velocity and acceleration of an
Q18: Suppose that a car traveling to the
Q21: If the velocity of an object is
Q21: During the time that the acceleration of
Unlock this Answer For Free Now!
View this answer and more for free by performing one of the following actions

Scan the QR code to install the App and get 2 free unlocks

Unlock quizzes for free by uploading documents