The information in the chart below gives the salary of a person for the stated years. Model the data with a linear function using the points (1, 24,100) and (3, 26,300) . Then use this function to predict The salary for the year 2005. 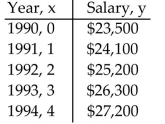
A)
B)
C)
D)
Correct Answer:
Verified
Q70: Solve the problem.
-The bank's temperature display shows
Q71: The paired data below consist of the
Q72: Write a cost function for the
Q73: Assume that the sales of a certain
Q74: Graph the equation.
-x = -5 
Q76: The outdoor temperature rises to 22° Fahrenheit.
Q77: Find the correlation coefficient.
-Consider the data
Q78: Solve the problem.
-Find an equation for the
Q79: Find the slope of the line.
-A
Q80: In the table below, x represents
Unlock this Answer For Free Now!
View this answer and more for free by performing one of the following actions

Scan the QR code to install the App and get 2 free unlocks

Unlock quizzes for free by uploading documents