In the table below, x represents the number of years since 2000 and y represents annual sales (in thousands of dollars) for a clothing company. Use the least squares regression equation to Estimate sales in the year 2006. Round to the nearest thousand dollars. 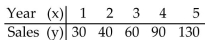
A)
B)
C)
D)
Correct Answer:
Verified
Q75: The information in the chart below
Q76: The outdoor temperature rises to 22° Fahrenheit.
Q77: Find the correlation coefficient.
-Consider the data
Q78: Solve the problem.
-Find an equation for the
Q79: Find the slope of the line.
-A
Q81: Solve the problem.
-Suppose the function y =
Q82: Solve the problem.
-Ten students in a
Q83: Find an equation in slope-intercept form (where
Q84: Graph the equation.
-For the following table of
Q85: Find the slope of the line.
Unlock this Answer For Free Now!
View this answer and more for free by performing one of the following actions

Scan the QR code to install the App and get 2 free unlocks

Unlock quizzes for free by uploading documents