The diagram on the right shows the record of one earthquake on seismograms at three different stations in a seismic network. These three seismograms show: 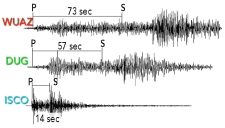
A) ISCO station is closest to the earthquake
B) WUAZ station was right at the earthquake
C) DUG station is farthest from the earthquake
D) WUAZ is the closest station, followed by DUG, and then ISCO
E) none of these
Correct Answer:
Verified
Q49: The image indicates that: Q50: The Modified Mercalli Intensity rating map on Q51: On this time-travel curve, if a large Q52: What likely caused much of the damage Q53: Based on the three seismograms, which seismic Q55: Using this nomogram, what is the magnitude Q56: Which of the following places did NOT Q57: How do we determine the location of Q58: Which of the following did NOT cause Q59: Which of the following would NOT be![]()
Unlock this Answer For Free Now!
View this answer and more for free by performing one of the following actions

Scan the QR code to install the App and get 2 free unlocks

Unlock quizzes for free by uploading documents