The Modified Mercalli Intensity rating map on the right shows intensity values that range from more than X to less than III. What does this map show? 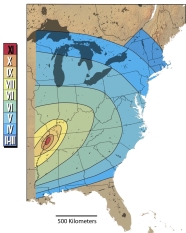
A) this earthquake had a Richter magnitude of 10 or 11 near the source
B) this earthquake had a Richter magnitude of 3 or 6 along the East Coast
C) the earthquake was not felt in southern Florida
D) shaking was felt only very near to the earthquake
E) building damage occurred in all of the zones that are shaded on this map
Correct Answer:
Verified
Q45: The huge 1964 Alaskan earthquake, one of
Q46: Which of the following are potential sources
Q47: Which are true of "Richter" or "Local"
Q48: The shaded areas on this map have
Unlock this Answer For Free Now!
View this answer and more for free by performing one of the following actions

Scan the QR code to install the App and get 2 free unlocks

Unlock quizzes for free by uploading documents