Interpret Information Given by Graphs
The line graph shows the recorded hourly temperatures in degrees Fahrenheit at an airport.
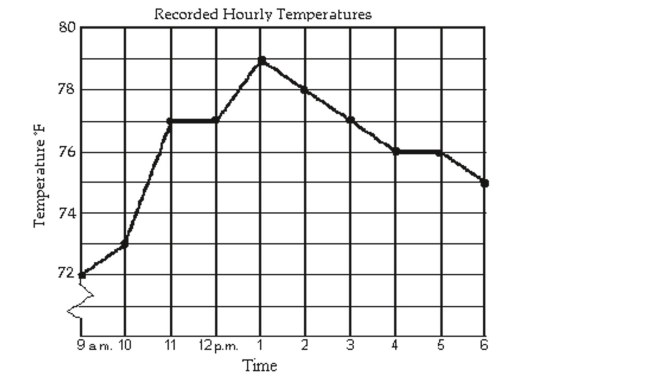
-At what time was the temperature its lowest?
A) 9 a.m.
B) 6 p.m.
C) 4 p.m.
D) 1 p.m.
Correct Answer:
Verified
Q26: Use the graph to determine the x-
Q27: Interpret Information About a Graphing Utility's Viewing
Q28: Interpret Information Given by Graphs
The line graph
Q29: The table of values was generated
Q30: Use the graph to determine the x-
Q32: Interpret Information Given by Graphs
The line graph
Q33: Use the graph to determine the x-
Q34: Interpret Information About a Graphing Utility's Viewing
Q35: Use the graph to determine the x-
Q36: Interpret Information Given by Graphs
The line graph
Unlock this Answer For Free Now!
View this answer and more for free by performing one of the following actions

Scan the QR code to install the App and get 2 free unlocks

Unlock quizzes for free by uploading documents