Multiple Choice
Below is a graph of a function . What is the limiting value for ? 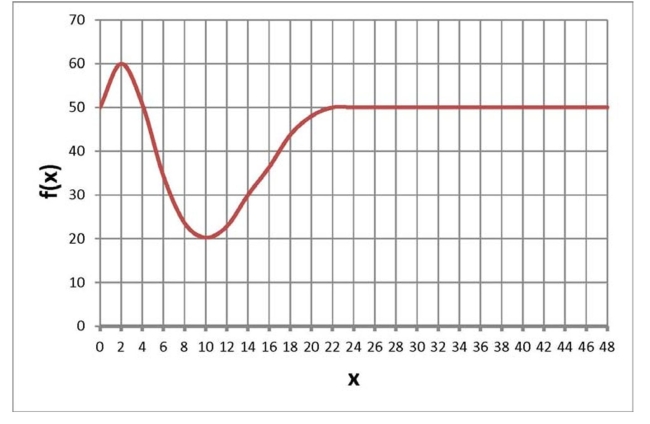
A) 60
B) 20
C) 50
D) None of the above
Correct Answer:
Verified
Related Questions
Q1: Choose the answer that best completes the
Q4: Q5: Below is a graph of a Q7: The following table shows average rice Q8: The temperature in degrees Fahrenheit can be

