The following scatterplot shows output/unit capital and years. The data show 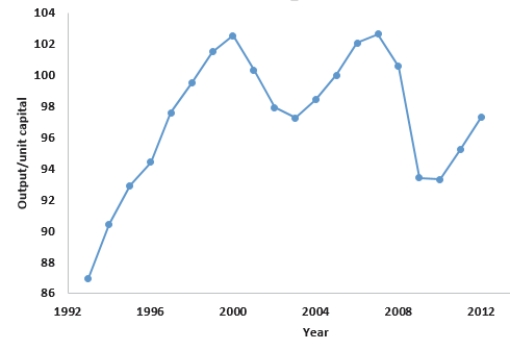
A) There is no consistent increasing or decreasing over time.
B) There is no evidence of a seasonal component.
C) There is some evidence of a cyclical component.
D) There is no linear trend over the time period.
E) All of the above.
Correct Answer:
Verified
Q8: Boxplots of earnings per share (EPS) data
Q9: A customer service center keeps track of
Q10: A government agency has 6000 employees. As
Q11: Boxplots of earnings per share (EPS) data
Q12: A government agency has 6000 employees.
Q15: A recent survey of online shoppers
Q16: A recent survey of online shoppers
Q17: The following scatterplot shows output/hour labor and
Q18: The U.S. Bureau of Labor Statistics publishes
Q61: What scale of measurement is type of
Unlock this Answer For Free Now!
View this answer and more for free by performing one of the following actions

Scan the QR code to install the App and get 2 free unlocks

Unlock quizzes for free by uploading documents