The following scatterplot shows output/hour labor and years. The graphical display is an example of what type of data? 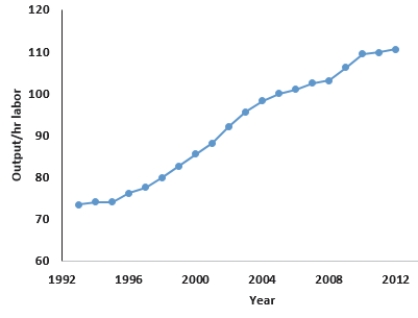
A) Cross-sectional
B) Nominal
C) Categorical
D) Time Series
E) Ordinal
Correct Answer:
Verified
Q12: A government agency has 6000 employees.
Q13: The following scatterplot shows output/unit capital and
Q15: A recent survey of online shoppers
Q16: A recent survey of online shoppers
Q18: The U.S. Bureau of Labor Statistics publishes
Q19: A recent report evaluated the price
Q20: A consumer research group investigating the relationship
Q21: Prices per share of the 20 most
Q61: What scale of measurement is type of
Q112: A manufacturer of cable wire periodically selects
Unlock this Answer For Free Now!
View this answer and more for free by performing one of the following actions

Scan the QR code to install the App and get 2 free unlocks

Unlock quizzes for free by uploading documents