Prices per share of the 20 most actively traded stocks on the New York Stock Exchange in October, 2012. A histogram for these data are shown below.
The data can be described as 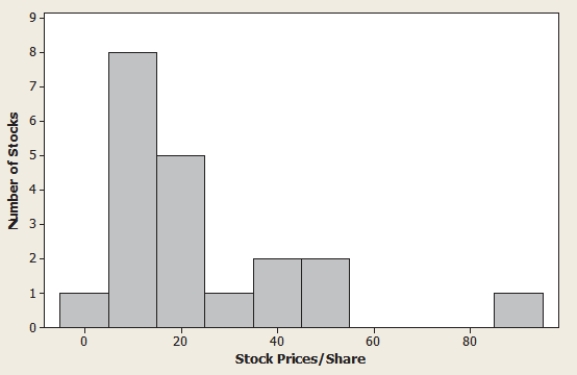
A) The data are skewed to the left with a large positive outlier.
B) 5.9 %
C) 17.9 %
D) The data are skewed to the right with a large positive outlier.
E) 13.4 %
Correct Answer:
Verified
Q16: A recent survey of online shoppers
Q17: The following scatterplot shows output/hour labor and
Q18: The U.S. Bureau of Labor Statistics publishes
Q19: A recent report evaluated the price
Q20: A consumer research group investigating the relationship
Q23: Prices per share of the 20
Q24: A magazine that publishes product reviews
Q25: US public debt per capita historical
Q26: Real estate agencies keep track of housing
Q112: A manufacturer of cable wire periodically selects
Unlock this Answer For Free Now!
View this answer and more for free by performing one of the following actions

Scan the QR code to install the App and get 2 free unlocks

Unlock quizzes for free by uploading documents