Figure: Demand and Supply of Shirts
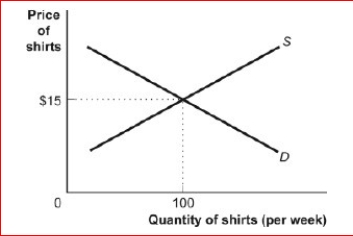
 (Figure: Demand and Supply of Shirts) Look at the figure Demand and Supply of Shirts.In the graph, if the line labeled D is a demand curve for shirts showing how many shirts per week will be demanded at various prices, then it is clear that as the price of shirts falls:
A.fewer shirts will be demanded.
B.more shirts will be demanded.
C.the same quantity of shirts will be demanded.
D.it is unclear what will happen to the demand for shirts.
Correct Answer:
Verified
View Answer
Unlock this answer now
Get Access to more Verified Answers free of charge
Q7: If two variables are negatively related:
A)as one
Q8: On a graph representing two variables:
A)a positive
Q10: Figure: Cold Drinks Sold and Temperature
Q11: The _ of a curve shows the
Q13: Figure: Good X and Good Y
Q14: (Table: Hours Studied and Quiz Score) Look
Q17: Figure: Hot Drinks Sold and Temperature
Q18: The relationship between two variables that move
Q19: Figure: Cold Drinks Sold and Temperature
Q20: When graphing a curve, the vertical intercept
Unlock this Answer For Free Now!
View this answer and more for free by performing one of the following actions

Scan the QR code to install the App and get 2 free unlocks

Unlock quizzes for free by uploading documents