Below is a frequency distribution table showing the number of cars sold by the 30 sales reps at Hermiston Kia during the past month.You plan to show the data in a "greater than or equal to" cumulative relative frequency table.What cumulative relative frequency would you show for 1 car? 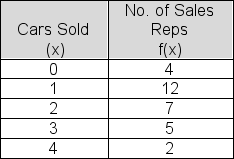
A) .533
B) .867
C) .767
D) .467
E) .133
Correct Answer:
Verified
Q118: Over the past 30 days, Kim recorded
Q119: Turcott Roof and Deck has 130 jobs
Q120: Purchasing agent Angela Rodriguez reported the number
Q121: Below is a table showing the ages
Q122: Test scores for 40 job applicants at
Q124: Test scores for 40 job applicants at
Q125: The number of days required per audit
Q126: The relative frequency table below shows the
Q127: Below is a table showing the number
Q128: Below is a table showing the number
Unlock this Answer For Free Now!
View this answer and more for free by performing one of the following actions

Scan the QR code to install the App and get 2 free unlocks

Unlock quizzes for free by uploading documents