The relative frequency table below shows the closing share price changes for the 100 most actively traded NASDAQ stocks yesterday.Use the grouped data table to approximate the standard deviation for the data represented. 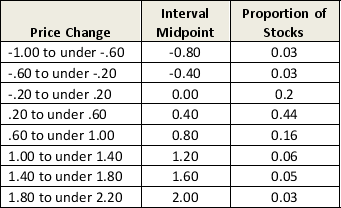
A) 1.22
B) .30
C) .83
D) .16
E) .55
Correct Answer:
Verified
Q121: Below is a table showing the ages
Q122: Test scores for 40 job applicants at
Q123: Below is a frequency distribution table showing
Q124: Test scores for 40 job applicants at
Q125: The number of days required per audit
Q127: Below is a table showing the number
Q128: Below is a table showing the number
Q129: Below is a frequency table showing the
Q130: Below is a table showing the ages
Q131: The waiting line of cars at In-N-Out
Unlock this Answer For Free Now!
View this answer and more for free by performing one of the following actions

Scan the QR code to install the App and get 2 free unlocks

Unlock quizzes for free by uploading documents