Multiple Choice
table given below shows the Consumer Price Index (CPI) for selected years. Use a graphing utility to plot the data and graph the model
A) 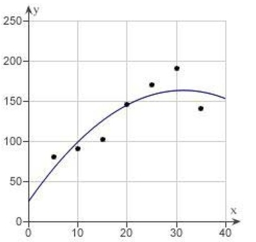
B) 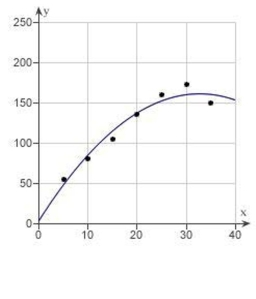
C) 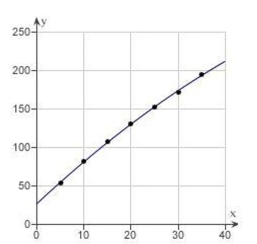
D) 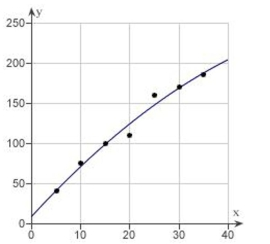
E) 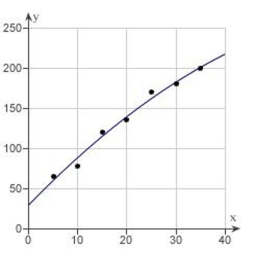
Correct Answer:
Verified
Related Questions
Q11: Q12: Q13: Q14: the points of intersection of the Q15: all intercepts: Q17: Sketch the graph of the equation: Q18: Table given below shows the Consumer Unlock this Answer For Free Now! View this answer and more for free by performing one of the following actions Scan the QR code to install the App and get 2 free unlocks Unlock quizzes for free by uploading documents

